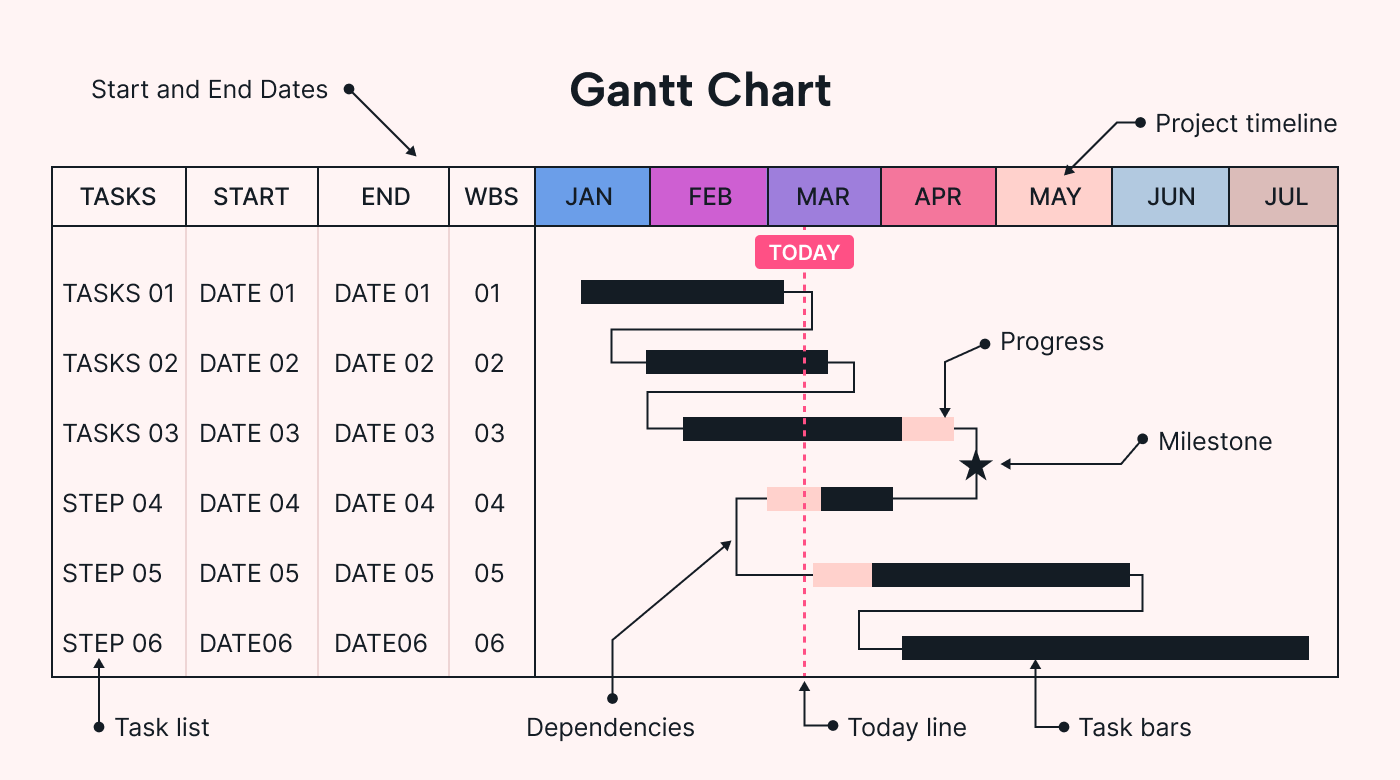
What is Gantt chart?
Gantt charts are powerful tools used in project management to visualize tasks, timelines, and dependencies. They offer a straightforward way to plan, track, and manage projects effectively. In this article, we’ll delve into the basics of Gantt charts, breaking down their key components and how they can benefit your project management endeavors.
What is a Gantt Chart?
At its core, a Gantt chart is a visual representation of a project schedule. It displays tasks, their start and end dates, and their relationships with one another. Imagine it as a timeline where you can see what needs to be done, when it needs to be done, and how tasks overlap or depend on each other.
Components of a Gantt Chart
What are the components of Gantt charts?
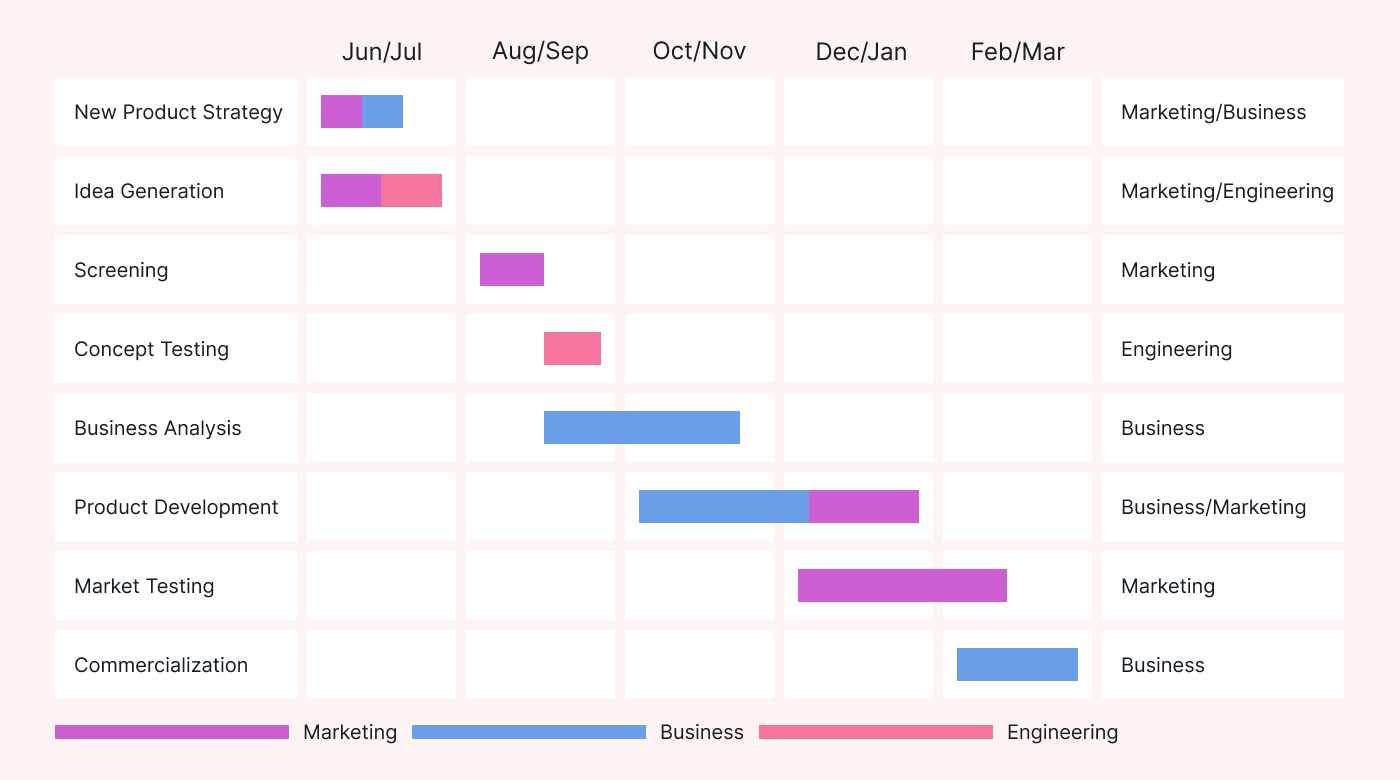
Tasks:
These are the individual activities or work items that need to be completed to reach project goals. Each task is represented by a bar on the chart.
Timeline:
The horizontal axis of the chart represents time, typically broken down into days, weeks, or months, depending on the project’s duration.
Bars:
Bars on the chart represent tasks. The length of each bar indicates the duration of the task, while their position along the timeline shows when they start and end.
Dependencies:
Gantt charts allow you to define dependencies between tasks, indicating which tasks must be completed before others can start.
Milestones:
These are significant points or events in the project timeline, such as project kickoff, major deliverables, or project completion. Milestones are often marked with a specific symbol on the chart.
How to Use a Gantt Chart?
Ok we have a Gantt chart, how to use it?
Planning:
Start by listing all the tasks required to complete the project. Determine their dependencies and estimated durations.
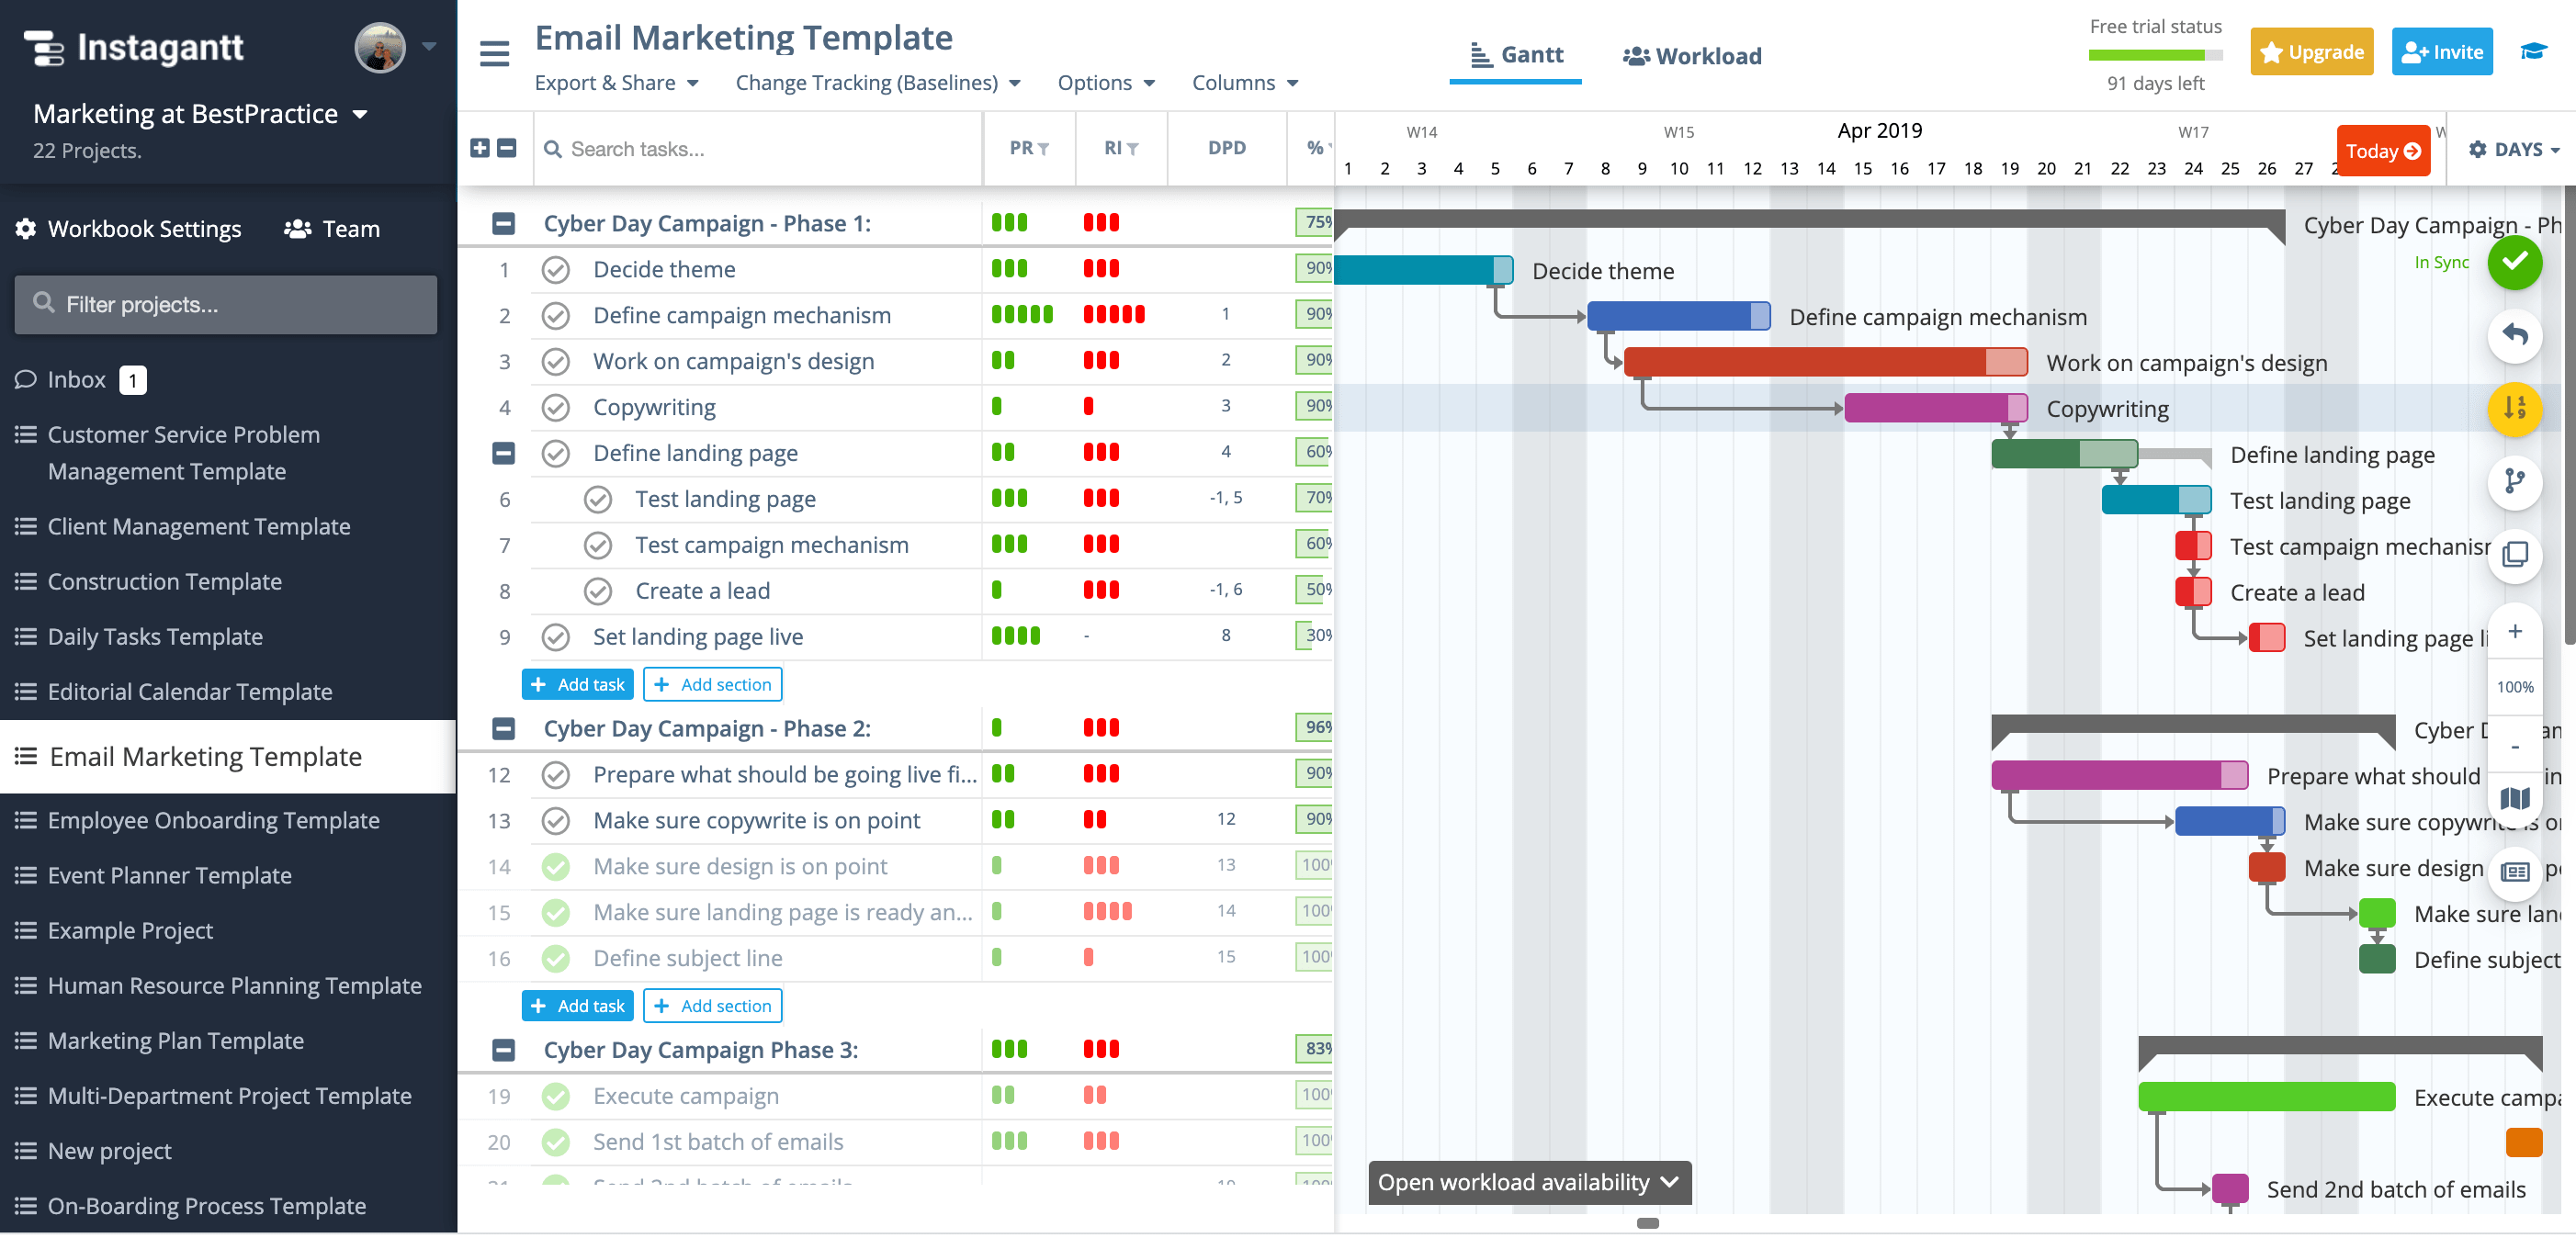
Creating the Chart:
Use project management software or a spreadsheet to create your Gantt chart. Input tasks, durations, and dependencies to build the schedule.
Monitoring Progress:
As the project progresses, update the Gantt chart to reflect completed tasks and any changes to the schedule. This allows you to track progress and identify potential delays.
Communicating with Stakeholders:
Gantt charts serve as a valuable communication tool for stakeholders, providing a clear overview of project timelines and progress.
Benefits of Using Gantt Charts:
Clarity:
Gantt charts offer a clear visual representation of project timelines, tasks, and dependencies, making it easy to understand the project’s scope and progress.
Scheduling:
They help in scheduling tasks efficiently by identifying dependencies and allocating resources effectively.
Tracking Progress:
Gantt charts allow project managers to track progress in real-time, identify bottlenecks, and make adjustments to the schedule as needed.
Communication:
They facilitate communication between team members and stakeholders by providing a common understanding of project timelines and goals.
Conclusion:
In conclusion, Gantt charts are indispensable tools for project managers seeking to streamline project planning, tracking, and management. By simplifying complex project schedules into visual timelines, Gantt charts empower teams to stay organized, efficient, and focused on achieving project success. Incorporate them into your project management toolkit and witness the transformative impact on your projects.